Have you ever gazed at a map of the vast ocean floor and found yourself pondering how we even begin to understand what lies kilometres beneath the surface? Unlike exploring terrestrial landscapes, the ocean depths remain largely hidden from our direct view. Light struggles to penetrate beyond a few hundred metres, rendering traditional visual surveying impossible in the abyss. So, how do scientists, explorers, and cartographers create those intricate maps showing trenches, mountains, and plains hidden under miles of water?
The answer lies in a remarkable technology that uses sound as its eyes: Sonar. Just like bats use echolocation to navigate in the dark, ships use Sonar to ‘hear’ the shape of the underwater world. It’s essentially giving our vessels an extraordinary underwater superpower.
Before we dive deep into the mechanics, here’s a quick look at the magic of Sonar in action:
(Note: The YouTube Shorts video ID was not provided, please insert the correct ID in the iframe src attribute’s embed URL after /embed/ to display the video.)
Table of Contents
What is Sonar and How Does it Work?
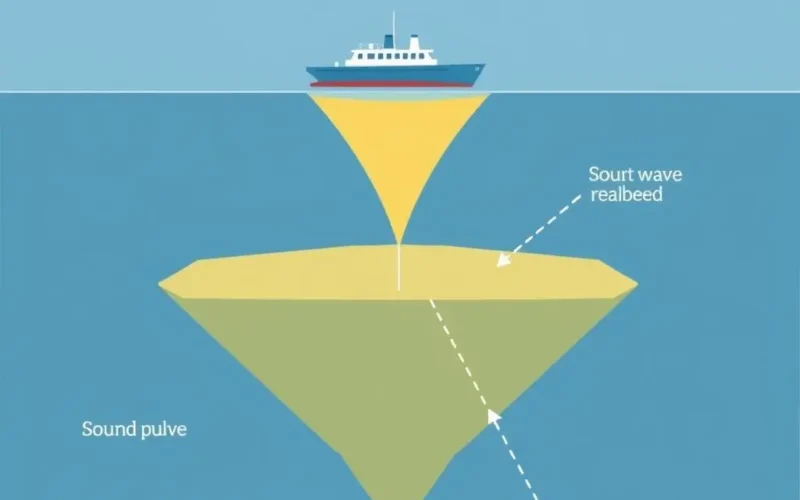
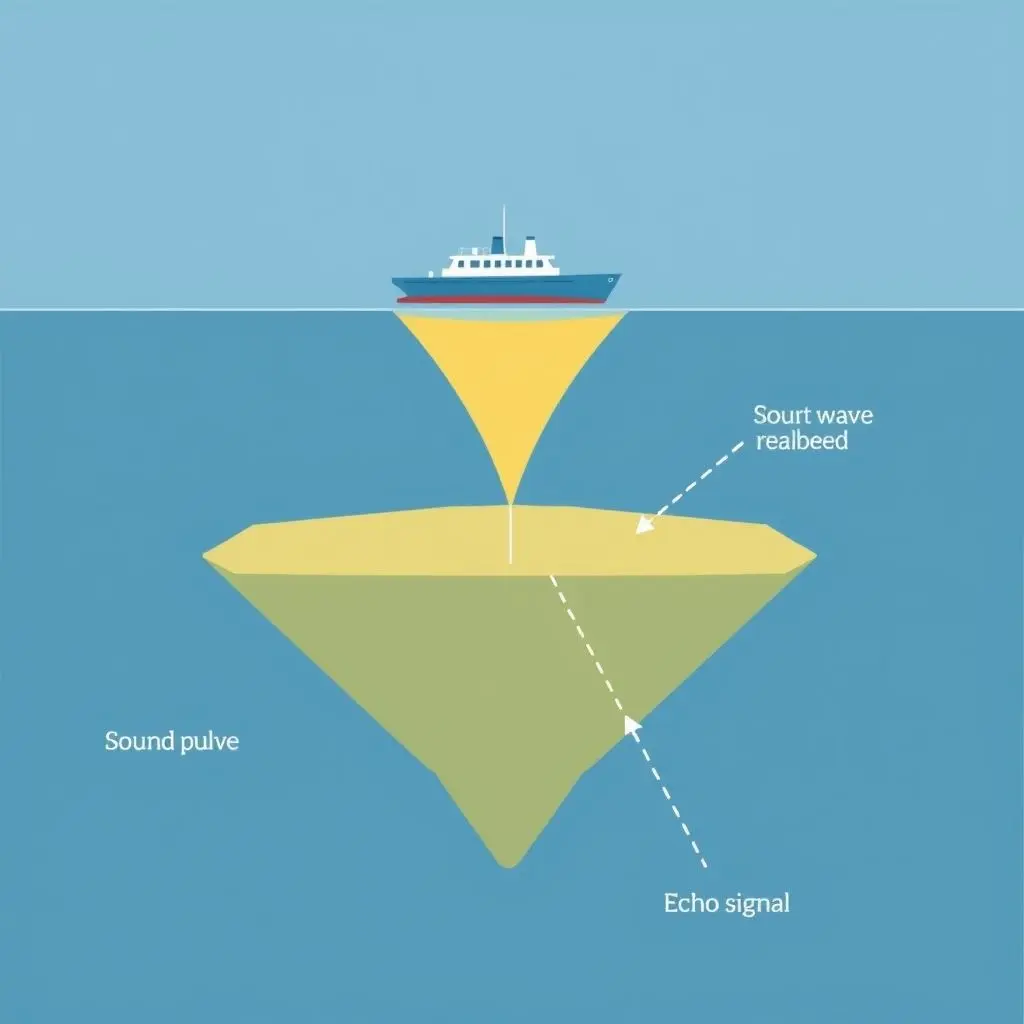
Sonar stands for SOund Navigation And Ranging. At its core, Sonar technology involves emitting sound waves and analysing the returning echoes. The principle is quite simple, yet its application in mapping the complex ocean floor is incredibly sophisticated.
Here’s the breakdown:
- Sending a Pulse: A Sonar system, mounted on the hull of a ship or towed behind it, sends out a short, sharp burst – a ‘ping’ – of sound waves. These sound waves are typically at frequencies higher than what humans can hear (ultrasonic), allowing for better resolution and directionality.
- Traveling Through Water: The sound pulse travels through the water column. The speed of sound in water is significantly faster than in air (about 1500 m/s compared to 343 m/s), but it can vary depending on factors like temperature, salinity, and pressure. Modern Sonar systems account for these variations.
- Hitting an Object or the Seafloor: When the sound pulse encounters an object – be it the seabed, a submerged wreck, a submarine, or even a school of fish – some of its energy is reflected back towards the source. This reflected sound is called an ‘echo’.
- Receiving the Echo: A hydrophone (an underwater microphone) or a transducer (which can both send and receive sound) on the Sonar system detects these returning echoes.
- Measuring Time and Distance: The crucial part for mapping is measuring the exact time it takes for the sound pulse to travel from the transmitter, hit the target, and return as an echo to the receiver. Since the speed of sound in the water is known (or calculated), the system can precisely calculate the distance to the object or the seafloor using the formula: Distance = (Speed of Sound × Time Taken) / 2 (since the sound travels down and back up).
By sending out numerous pulses in different directions or as the vessel moves, and measuring the return time of each echo, Sonar builds up a profile of the underwater terrain below and around the vessel.
Types of Sonar Used for Ocean Mapping
While the basic principle is consistent, different types of Sonar systems are employed to gather specific types of information for mapping the ocean floor. The choice of system depends on the required resolution, depth, coverage area, and the specific mapping objective.
Single Beam Echosounder
This is the simplest type, similar to the core explanation above. A single beam of sound is directed straight downwards from the vessel. It provides a direct measurement of the depth directly beneath the ship at specific points. Imagine walking in a straight line and taking depth soundings with a lead line, but much faster and more accurate. Single beam systems are useful for profiling specific routes or getting basic depth data, but they are slow for covering large areas and don’t provide detail of the seafloor between the points directly under the vessel.
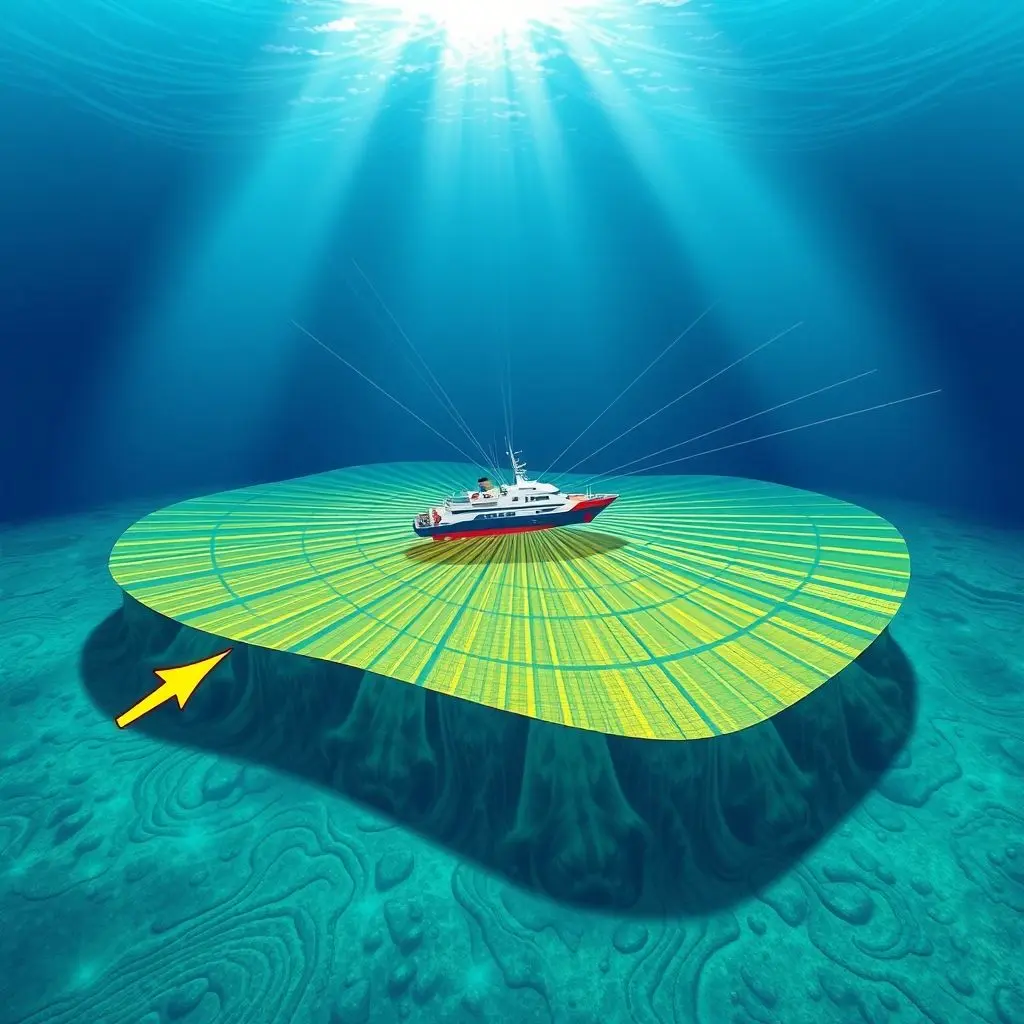
Multibeam Echosounder (MBES)
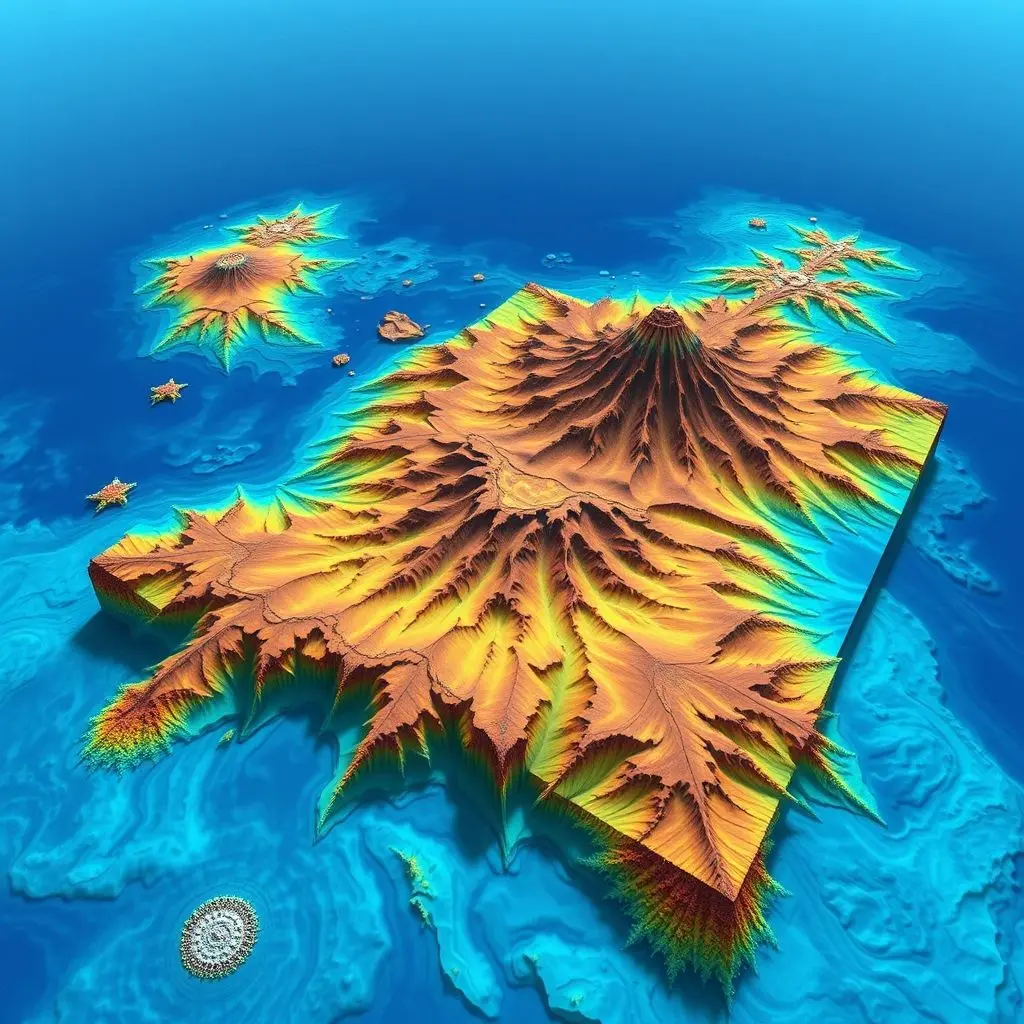
A significant advancement for efficient mapping, Multibeam Echosounders are the workhorse of modern ocean floor surveys. Instead of sending a single pulse straight down, an MBES transmits a fan-shaped array of sound beams (often hundreds or even thousands) across a wide swath perpendicular to the ship’s movement. Each beam in the fan measures the depth at a different point on the seafloor within that swath.
As the ship moves forward, these swaths are laid down side-by-side, like mowing a lawn, creating a continuous, high-resolution strip of bathymetry (depth data) along the survey line. By stitching together multiple passes, detailed 3D maps of the underwater landscape can be constructed, revealing canyons, ridges, and other features with remarkable clarity.
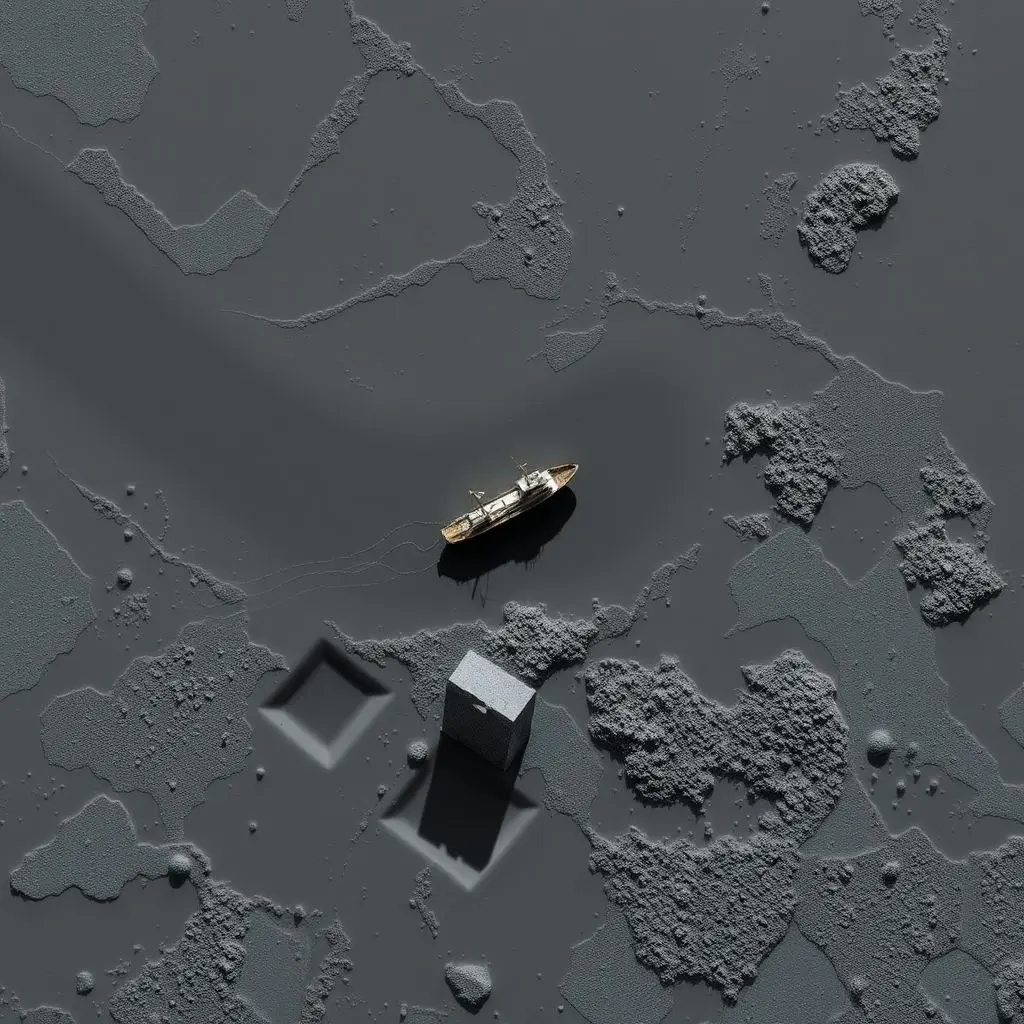
Side-Scan Sonar
Unlike single-beam and multibeam systems that focus primarily on depth (bathymetry), Side-Scan Sonar is designed to create detailed images of the seafloor surface. It sends out fan-shaped pulses of sound to the sides of the vessel, not straight down. The strength of the returning echo (the ‘backscatter’) provides information about the composition and texture of the seabed.
Harder materials like rock or metal produce stronger echoes (appearing brighter on the image), while softer materials like mud produce weaker echoes (appearing darker). Side-Scan Sonar is excellent for identifying objects on the seafloor (like shipwrecks, pipelines, or debris) and mapping the characteristics of the seabed sediment. It complements multibeam data, providing textural context to the depth information.
From Pings to Maps: The Data Processing Journey
Collecting Sonar data is only the first step. Turning raw acoustic signals into a usable map is a complex process involving sophisticated software and skilled technicians.
- Data Acquisition: As the Sonar system collects echoes, it also records precise navigation data (GPS), motion data (pitch, roll, heave of the vessel), and information about the water column properties (speed of sound). All this is crucial for accurate positioning and depth correction.
- Processing and Cleaning: The raw data is processed to remove noise, spikes (erroneous readings), and correct for the vessel’s motion and variations in the speed of sound. This is a critical step to ensure the accuracy and quality of the final map.
- Geo-referencing: Each depth or backscatter measurement is precisely located in space using the navigation data. This process, called geo-referencing, ensures that the collected data aligns correctly on a geographical grid.
-
Creating Visualizations: The processed and geo-referenced data is then used to generate various outputs:
- Bathymetric Charts: These are 2D maps showing depths using contour lines or colour gradients.
- 3D Models: Software can create detailed three-dimensional representations of the seafloor topography.
- Side-Scan Mosaics: Processed side-scan data is stitched together to create a continuous image mosaic of the seabed surface.
Ping after ping, echo after echo, meticulously collected and processed, these data points come together to form detailed, high-resolution pictures of the underwater landscape – essentially, the maps of our hidden planet.
Why Mapping the Ocean Floor Matters
Knowing the shape and composition of the seafloor is far from just an academic exercise. It has profound implications for numerous human activities and scientific endeavors:
- Navigation and Safety: Accurate bathymetric charts are essential for safe maritime navigation, especially for large vessels in coastal areas or busy shipping lanes. Knowing water depths and identifying underwater hazards like rocks or wrecks prevents groundings and accidents.
- Resource Exploration and Management: Mapping helps locate potential offshore resources such as oil and gas deposits, mineral nodules, and aggregates. It’s also crucial for planning and managing sustainable fisheries by understanding marine habitats.
- Scientific Research: Seafloor maps are fundamental for studying marine geology, plate tectonics (mid-ocean ridges, trenches), ocean currents (which are influenced by topography), and marine biology (understanding how habitats relate to depth and terrain).
- Environmental Monitoring and Conservation: Detailed maps help identify sensitive habitats like coral reefs or seagrass beds, plan marine protected areas, and monitor changes caused by natural processes or human activities.
- Cable and Pipeline Laying: Planning routes for subsea cables (internet, communication) and pipelines (oil, gas) requires detailed knowledge of the seafloor topography to avoid obstacles and ensure stability.
- Defense and Security: Understanding the underwater environment is critical for naval operations, submarine navigation, and detecting foreign vessels or objects.
Sonar technology literally allows us to see the unseen, opening up the vast majority of our planet’s surface – the 70% covered by oceans – to exploration and understanding.
Common Questions About Sonar Mapping
How deep can Sonar map?
The depth penetration of Sonar depends heavily on the frequency used and the power of the system. Lower frequencies travel further than higher frequencies. Deep-sea multibeam systems operating at lower frequencies (e.g., 12 kHz) can map the full ocean depth, down to 11,000 metres (the depth of the Mariana Trench). Higher frequency systems (e.g., 100-400 kHz) offer higher resolution but are limited to shallower waters, typically a few hundred metres.
Is Sonar harmful to marine life?
This is a complex and debated topic. High-intensity Sonar, particularly military Sonar, has been linked to negative impacts on marine mammals, potentially causing disorientation, behavioral changes, and even strandings. However, mapping Sonar used for charting (echosounders, multibeam, side-scan) is generally lower intensity than military active Sonar. While any sound in the ocean adds to the ambient noise, the specific impact of mapping Sonar on marine life is an ongoing area of research and mitigation efforts.
How much of the ocean floor has been mapped in detail?
Despite the importance of ocean mapping, the vast majority of the ocean floor remains unmapped in high resolution. Estimates vary, but generally, only about 20-25% of the global ocean floor has been mapped using modern, high-resolution methods like multibeam Sonar. The rest is either unmapped or only covered by older, lower-resolution single-beam data. Initiatives like the GEBCO Seabed 2030 project aim to map the entire ocean floor by 2030, highlighting the significant work still needed.
Can Sonar see through the seabed?
Standard Sonar systems like single-beam, multibeam, and side-scan image the surface of the seabed. However, there’s another type called Sub-Bottom Profiler that uses lower frequencies with more power to penetrate the seafloor sediment layers, revealing the geological structure beneath the seabed surface. This is used for studying sediment layers, finding buried objects, or assessing areas for construction.
Peering into the Blue Unknown
From the simple ping of early systems to the complex fan of beams from a multibeam echosounder, Sonar technology has revolutionised our ability to explore and understand the underwater world. It has transformed the opaque depths into a landscape we can measure, map, and visualise, revealing staggering geological features and hidden wonders.
The ongoing effort to map the entire ocean floor is a monumental task, crucial for navigation, resource management, scientific discovery, and protecting marine environments. Each ping contributes another data point, slowly but surely lifting the veil on the mysteries of the deep blue, one echo at a time.
Related posts:
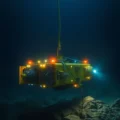 Peering into the Abyss: The Incredible Tech Making Deep Sea Exploration Possible
 Street View Maps in India, a reality with Wonobo Maps
 Tech to the Rescue: Giant Nets and Clever Bots Fighting Ocean Plastic
 How to install Google Maps app on iPhone 5, iOS 6
 Silent Navigators: How Submarines Plot Their Path Without GPS